The Hidden Gold of Property Inspections

I have been accused of being over enthusiastic at times, but hey, that’s how I roll and we are talking commercial appraisals so hear me out!!

With that caveat, an enjoyable part of the appraisal process is the chance encounter with a property owner on the street. Sometimes, getting out of the car and physically walking and taking pictures can result in finding hidden valuable information about the market. Although I’ve never been a police detective, I can only assume it carries a similar feeling when a major clue is discovered that really helps support the case. Recently, I was taking pictures of two buildings across the street from the property being appraised and was not yet aware of recent sales history.

The property owner saw me on the street taking photos from his second story office window and came down and asked what I was doing. I was able to share with him I was appraising the property across the street and was taking photos of the surrounding area. Sometimes, in order to get, it’s important to give so I first provided market intel about other recent sales and the fact there was a pending sale of the property across the street.

This helped build trust with the property owner and this random conversation led to finding two new comparable sales with fully verified details of the transactions. Both proved to be excellent data points for the property being appraised. In smaller real estate markets, boots on the ground market research can be invaluable. I often state that great data helps lead to a great appraisal and helps the appraiser have greater confidence in supporting the market value conclusion.

Mitchell Simonson, MAI has been in commercial real estate for 15 years and founded Simonson Appraisals on January 1, 2019. Need help with commercial real estate? Contact us today! To learn more or to order an appraisal, visit www.simonsonappraisals.com.

Work Hard, Play Harder

work hard, play hardWork Hard, Play Harder is one of my favorite mantras. I love working hard because it is the fuel that allows me to play harder with my family and pursue those hobbies and passions that allow me to live a fully charged life!

This past weekend, I spent four days with my dad, brothers and brother-in-law’s in San Diego, CA. We enjoyed lots of fun in the sun and good laughter. I was filled with gratitude to break away from the everyday hustle and recharge the batteries.

On the airplane ride home Sunday night, I shifted my mind to prepare for the week and months ahead. I was able to review my 2019 goals and plan how I can show up with incredible energy and enthusiasm for my family, friends and clients.

One of my goals in building a successful commercial real estate appraisal is to also show up for my family by being fully present and help them maximize all they are capable of. Playing hard provides new fuel to run a business and deliver high quality work.

Commercial real estate appraisals require writing and weaving the story of the property into a report that allows the client to understand the value or values that are being provided. Through continuous education, analyzing market data and speaking with market participants, the story becomes well supported and credible values are established. Challenging property types, changing market conditions and steady report deadlines create demands on the appraiser to constantly be learning, growing and improving. Thankfully, utilizing the latest in appraisal report writing technology and market research tools allows our firm, Simonson Appraisals to deliver a product to the client that satisfies their needs.

I’m excited to come back from a long weekend invigorated and revitalized to Work Hard and prepare for the next opportunity to Play Harder!

Mitchell Simonson, MAI has been in commercial real estate for 15 years and founded Simonson Appraisals on January 1, 2019. He can be reached at 612-618-3726 or mitch@simonsonap.com. To learn more or to order an appraisal, visit www.simonsonappraisals.com.

Mentors in Life and Real Estate

22188

Who is a great mentor in your life?

On a recent RV road trip to Montana with my family (my favorite family activity!), I found myself driving late at night while everyone was sleeping with the time and mental space to contemplate and reflect on my life! For me, windshield time on longer distance road trips has proven to be one of my favorite places to take a pause from the everyday grind and hustle of life and reflect on what I’m grateful for and gain inspiration to reach for new goals.

It allows me to slow down my mind to recharge the batteries (blame it on my Type A, go-go-go personality) and get me excited to come back and hit the ground running.

During this particular evening, I was pondering several mentors in my life who have been instrumental in helping to guide my life through several important times. Since I was already mentally preparing to launch Simonson Appraisals on January 1, 2019, I couldn’t help but think of several people who have helped me make strategic career moves over the course of the past 25 years since I got my first job.

What I found interesting is that many of the bosses I worked for in various positions have inspired me to reach up and continue growing, expanding and reaching for new opportunity. They have provided me many new tools, ideas and inspiration to live a more fully charged life. I’d like to share a few examples.

I started working at the young age of 11 and my first mentor outside of my parents was my first boss who also happened to be my aunt. Working in a small family business, she possessed many great attributes and was a catalyst in my decision to go to college and pursue a four-year degree. Coming from a blue-collar background, college was not a major priority. However, my aunt instilled in me the potential value that I could gain from pursuing further education. It was this perspective that propelled me to pursue a different path.

While college may or may not the right answer for everyone, I was fortunate to find a career path in college I’m passionate about and has afforded many great opportunities.

Upon entering the workforce in Phoenix, Arizona after graduating college in 2005, my first boss was a 76 year old gentleman who had been in the commercial real estate appraisal profession for 50 plus years. While the expectations were high to deliver high quality work, the immense value he brought to my career catapulted my career forward due to his willingness to sit down with me and teach so many important appraisal fundamentals. I often reflect how one year in Arizona working with him armed me with what feels like several years of valuable training.

Six years ago, I moved into my first ownership role in an appraisal company. One of my first goals I established at that time while starting as an entrepreneur was to acquire an income-producing property for investment purposes. I will admit, I didn’t know how it would happen, but began the path of learning as much as possible to acquire the knowledge necessary to make it happen.

Shortly after establishing the goal of acquiring a property, a new investment mentor magically appeared in my life. One of the great benefits I find as an appraiser is the people I get the privilege of meeting and working with. Many of them have created multiple streams of income and often share a similar story of starting with one property and expanding over time.

I first met the investment mentor at a property inspection. We immediately connected and ended up following up with a lunch meeting. I shared with him my dream of acquiring an investment property. It turned out, he had come from a small town, acquired his first property many years prior and built up a substantial real estate portfolio over time. We subsequently met two or three more times over the next 12 months for breakfast or lunch and through this relationship, I compiled two pages of detailed notes that outlined the most important criteria to consider when buying property.

I then continued on with my appraisal career, saving a few loose nuggets, and began pursuing more aggressively first property. Three years after my first meeting with the investment mentor, I closed on my first real estate investment property. Here is the fun part of the story. I admit that I had kind of forgot about the conversation with my mentor but had saved my detailed notes.

Amazingly, a month after buying my first investment property I stumbled across the notes with my real estate mentor. On the first page, I had five highlighted pearls of wisdom to adopt when analyzing and considering the purchase of an investment property. After comparing the notes with the details and characteristics of the investment property I had acquired, four of the five items matched the criteria perfectly. The fifth item did not apply to that particular property. Without that investment mentor, I wonder how that first acquisition would have happened.

If you are looking to grow and excel in an area of life that you have haven’t yet experienced the level of success you desire, Tony Robbins says to find someone who is already achieving it and seek to learn from them the best path to get there. It helps to eliminate a lot of pain and frustration and allows you to achieve the goal much more quickly.

Mentors can be a great way to learn, grow and achieve faster results in any area of life! I am committing to find a few new mentors in 2019 to help take my life and business to the next level. One of my main driving forces is I want to be an inspiration to my children to show them they can accomplish whatever they set their mind to!

What area of life do you want to become excellent at and who do you know that is already achieving the level of success that you aspire to? Take action today and reach out to them and begin the path of pursuing excellence!

Cheers to an Awesome 2019!

Mitchell Simonson, MAI is a commercial real estate appraiser and investor. He founded Simonson Appraisals on January 1, 2019. In addition to being active in commercial real estate, he enjoys studying and writing about personal development to help design and live a fully charged life. He can be reached by phone at 612-618-3726 or email at mitch@simonsonap.com.

Greater Minnesota – 2018 Apartment Trends

Victory Court Apts, 551 Victory Ave S, Sartell

The following analysis is market information about greater Minnesota apartment trends based on observations compiled by Mitchell Simonson, MAI.

Greater Minnesota – 2018 Apartment Trends

Over the past 12 months, I have appraised numerous greater Minnesota apartments ranging in size from about 20 to 150 units. The geographic region has spanned the “banana belt” surrounding the Minneapolis/St. Paul metropolitan area. The primary cities forming the “banana belt” include Rochester, Mankato, St. Cloud and Duluth, as well as smaller rural towns in between. This allows us to complete in-depth analysis of historical income and expense statements on completed assignments. Additionally, our firm supplements the internal observations and data by constantly interviewing apartment owners, brokers, property managers and lenders.

The following discusses general rent, vacancy, operating expense, and capitalization rate trends in greater Minnesota. A quick overview of each is summarized below, followed by more details.

Rents – Generally speaking, rents remained strong in 2017, with most communities able to increase rents. The exception is Fargo/Moorhead as most apartment property managers are now offering free month rental incentives.

Vacancy Trends – Vacancy rates in communities such as St. Cloud, Mankato, Rochester, county seats and smaller communities remained quite low. Fargo/Moorhead is experiencing significant over supply and vacancies have climbed north of 9.9%.

Operating Expenses – Operating expenses in greater Minnesota have held pretty stable. With rising sale prices, real estate taxes continue to be a concern for property owners.

Cap Rates – Cap rates appear to have remained relatively stable in 2017, with some compression in the larger communities.

Rent Trends – The quick story here is rents continued their upward ascent that has now been in place for several years in the greater MN apartment market. Overall, low vacancies and steady renter demand allowed owners and managers to implement one or more rent increases. However, not all properties are operated and managed the same and some owners tend to be more conservative with regard to rent growth.

Vacancy Trends – In 2017, it seemed nearly every greater Minnesota community surveyed with the exception of Fargo/Moorhead had stabilized vacancy rates (less than 5%). According to data compiled by Fargo appraisal firm Appraisal Services Inc., the current vacancy rate in Fargo-Moorhead metropolitan area is 9.91%. This represents a slight increase from 9.21% one year ago. The following table shows the quarterly vacancy rate and number of units under construction in the Fargo-Moorhead metropolitan area over the past five years.

Fargo Vacancy Chart

Source: Appraisal Services Inc

Over 6,000 units have been added to the Fargo market area since 2013, when vacancy rates reached a floor of 2.6% metro wide.

The low vacancy rates across most of greater Minnesota are attributable to favorable employment and economic trends and rental rates that remain below levels necessary to support new construction costs. The larger markets such as Rochester, Mankato, St. Cloud and Duluth have seen new apartment development. Similar to last year, most participants do not anticipate significant changes in vacancy in 2018.

Operating Expenses – Real estate taxes are generally cited as the one major area of concern. As values have increased over the past few years and sales become available, this tends to be the one consistent expense line item that is of concern to investors. Utility expenses tend to increase annually. A review of historical operating expenses for most properties suggests relatively stable expenses for other line items. With low vacancies in most markets and steady rent increases, operating expense ratios have stayed flat or decreased. Rising labor and maintenance costs have reportedly been a concern in Minneapolis/St. Paul metro area properties, but not as much in outstate areas.

Capitalization Rates

Capitalization rates appear to have remained relatively stable in 2017, with some compression in the larger markets. It has been evident over the past several years that more buyers are searching for investment opportunities beyond the Minneapolis/St. Paul metro area. Higher quality apartments in the larger communities (such as Fargo, Mankato, St. Cloud, etc.) are in the approximate range of 6.00% to 7.00%. Rochester and St. Cloud have seen a few larger, newer properties trade with cap rates below 6.0%. Cap rates for average-to-good quality properties in smaller communities generally range from about 6.75% to 7.75%. Properties with some level of deferred maintenance and/or older properties tend to sell at cap rates of 8.00% and above. Of course, each property is unique and must be analyzed independent of the general market parameters.

Most market participants report general optimism for continued strength in the greater Minnesota apartment market, particularly with a stable tenant base.

What are your expectations for greater MN apartment activity in 2018?

Are you looking for information on valuation trends in Minneapolis/St. Paul metro area? This link can help you: https://simonsonrealestate.wordpress.com/2018/01/23/minneapolis-st-paul-2018-commercial-real-estate-valuation-trends

Mitchell Simonson, MAI is an expert commercial real estate appraiser and investor. Since 2005, Mitchell has appraised hundreds of commercial real estate properties across many property types.

Real estate is a great vehicle to create long-term wealth! He speaks, consults and trains on Helping Lenders, Brokers and Investors Navigate the Appraisal Process and to ensure his clients are making wise commercial real estate investment and underwriting decisions to help them meet those goals.

To inquire about booking Mitchell for consulting or appear at your next conference or event, please email mitch@simonsonap.com or call at 612-618-3726.

Minneapolis/St. Paul – 2018 Commercial Real Estate Valuation Trends

20161116_131602

I attended the 2018 Minneapolis/St. Paul Commercial Real Estate Valuation and Appraisal Forecast Summit held at the Golden Valley Country Club on Friday, January 19, 2018. Topics centered on valuation trends for the retail, industrial, office and multi-family property sectors. This article looks back on some trends from 2017 and expectations in 2018.

My Top Takeaways for the Four Property Types

Retail – Contrary to headlines, brick-and-mortar retail is not dead. Rather, realize retail is changing, some brands are dying and new brands are replacing them. Overall, retail is performing fine.

Industrial – According to CBRE, the Minneapolis/St. Paul industrial market has had 30 straight quarters of positive absorption. While this is a longer positive run than normal, and historically, we tend to see market corrections, current signs and trends point to continued strong industrial demand.

Office – The office market saw record high per square foot sale prices in 2017 for CBD and suburban multi-tenant office buildings. Two examples include Fifty South Sixth in the Minneapolis CBD selling for $370/SF and The Colonnade, a suburban property in Golden Valley sold for $281/SF. This also points to the continued bifurcation of rental rates as some Class A rents are approaching levels that are causing tenants to retreat to Class B options or different submarkets.

Multi-Family – Strong market fundamentals supported by job growth and lifestyle choices among baby boomers and millennials provide a continued sense of optimism in multifamily. While many would agree we are at a current high peak, next year will mostly likely be a higher peak because of strong fundamentals.

Retail Market
If you only study the headlines, one could quickly begin to think, is brick and mortar retail dying? The short answer is NO! Rather, retail is changing, some old brands are dying and new brands are stepping in to replace them.  One reality with the changing market dynamics is the economic life of most retail properties is shortening. While online shopping has certainly had an impact, think of an older brand like Sears/Kmart. The audience of about 200-300 was asked who had shopped there during the holiday season. There were probably fewer than 10 participants who shopped at these stores. Despite store closures in the Twin Cities, a lot of space is getting backfilled.

Another example of changing retail trends is the recent January 2018 announcement by Sam’s Club to close about 63 stores across the country. With 597 locations, this is a 10.6% reduction in store count. However, about 10 to 12 of the properties will be converted to distribution centers. The company attributes this decision to the need to better fulfill online orders, less population growth than expected in some markets and too many competing locations. Thus, it’s an example of right-sizing and adapting to changing market forces.

There has also been talk about the future of some regional malls. Attention local cities! Are you looking to increase your tax base? Look at parking fields around the larger malls and reconsider the current parking ratio requirements. Perhaps these can be modified and additional value can be unlocked.

In many instances, developers and property owners are working to reposition these assets and taking advantage of substantial parking lot space to increase density and unlock the value of the underlying real estate. A great example is the Southdale Center in Edina. Working to expand the live/work/play model and capitalize on excess parking areas, additions include a 146-room Homewood Suites by Hilton and Lifetime Fitness replacing JC Penney, One Southdale Place, a luxury apartment complex and additional retail.

Overall, the 1031 tax exchange market continues to perform at a healthy pace. In 2017, the bid-ask spreads widened a bit so deal flow slowed a bit. With new tax laws that take effect in 2018, it brings certainty to buyers. One trend investors are seeking is Amazon proof stores. An example would be coffee shops – it’s hard to get hot coffee delivered to your door.

Location, location, location…. retailers will pay premium rents for a great location. However, as an investor or underwriting retail property, it’s important to understand the rent to sales ratio of a particular location to gauge the long-term viability of the tenant. Healthy ratios or total cost of occupancy/gross sales can vary among retail tenants from 5%-20%. Healthy rent-to-sales ratios are vital for tenants to maintain profitability. Rents that are too high to support sales for the location greatly increase the risk in tenants vacating, struggling or restructuring the lease term upon renewal to a lower rate.

Multi-tenant retail centers are performing well. Cost of construction is up, partly due to higher standard of building design requirements among cities and tenants. Most tenants seem to be doing well and business is up for most service tenants. Smaller, multi-tenant strip centers have been selling to 1031 buyers, but are dependent on tenant mix. In recent years, buyers are more sophisticated and knowledgeable and spend more time understanding the properties and tenants.

Daycare centers are in high demand with some cap rates lower than Walgreens transactions. In the acquisition of these properties, it’s important to understand if the demographics of the area will support daycare use over the long term.

National brand auto repair property type cap rates are often less than 6.0%. Strong demand exists. Longer term, it will be important to keep an eye on the evolution of autonomous vehicles as that could impact demand.

For strong credit, triple net tenants, cap rates are about 5.0% to 6.0% and about 6.0% to 7.0% for moderate credit tenants. Some grocery anchored center cap rates dipped below 6.0%. Multi-tenant retail centers cap rates tend to be slightly higher in the range of about 6.0% to 8.5%. Class C properties, particularly in outstate MN exhibit a wide cap rate range and can approach 10% or higher. Of course, each deal is underwritten separately and heavily dependent on the location, building quality, tenant mix and lease term.

Industrial Market
According to CBRE Q42017 Industrial Marketview, Minneapolis/St. Paul industrial market has had 30 straight quarters of positive absorption. While this is a longer positive run than normal, and historically, we tend to see market corrections, most market participants opine and current trends point to continued strong industrial demand.

With positive absorption, industrial development continues. In the fourth quarter alone, 10 new buildings were completed that added about 1.3 million square feet to the market. This included five build-to-suit projects and five spec completions approaching 1.0 million SF. The spec buildings were about 68% leased at completion. CBRE reports current vacancy as of Q4 2017 at 4.2%.

Significant demand exists for new, modern and updated buildings. With continued need to achieve last mile distribution centers, the brokers on the panel stated opportunity exists to convert smaller, older buildings with lower clear heights to meet that need. They are also seeing some of these buildings being converted to office use.

As the Southwest Light Rail Transit (SWLRT) project continues to move forward, this is forcing some industrial users to prepare for relocation. Cities along this corridor include Minneapolis, St. Louis Park, Hopkins, Minnetonka, and Eden Prairie. Smaller, owner user buildings are in high demand and buildings that stay on the market longer tend to have some level of functional obsolescence. For those needing to relocate, the challenge is finding replacement properties, especially with limited supply and strong pricing.

With low unemployment across the Minneapolis/St. Paul metropolitan area, employers report increasing difficulty finding employees for standard manufacturing/industrial type jobs. As a result, industrial employers are looking for location and building amenities to create attractive work environments to capture better labor.

Where are market rents for industrial properties? The general rule of thumb of $8.00/SF for office and $4.00/SF for warehouse may apply for older office/warehouse space, but newer construction buildings are achieving higher rents. On some buildings, rents are $10.00 – $12.00/SF for office and $5.00/SF for warehouse. Some of the higher lease rates are due to construction costs and higher levels of finish. At present time, new users are getting more comfortable with longer lease terms of seven to years. This compares to several years ago when three to five year terms were the norm. This is likely a combination of market availability and confidence in fundamentals. Landlords seem more willing to amortize tenant improvements.

Where are capitalization rates?

  • Industrial – High quality, new industrial investment grade have seen cap rates in the 6.0%-6.75% range. More coastal buyers are looking at opportunities in the Twin Cities due to higher rates of return that can be achieved.
  • Good quality, owner user oriented buildings in Minneapolis/St. Paul are about 7.0% – 8.0%. Extending to fringe and beyond, cap rates exceed 8% and upwards of 9.0%.

Office Market
The Minneapolis/St. Paul office market saw record high per square foot sale prices in 2017 for CBD and suburban multi-tenant office buildings. Two examples include Fifty South Sixth in the Minneapolis CBD selling for $370/SF and The Colonnade, a suburban property in Golden Valley sold for $281/SF. The buyer of the Fifty South Sixth property was Singapore based investor Mapletree. As pointed out by JLL, several Minneapolis CBD trophy assets have attracted global capital from China, Germany, Canada, Israel, the Mideast, and now Singapore.

In downtown Minneapolis, office vacancy is about 17%. Still dealing with excess space as Wells Fargo moved from multi-tenant space to their Downtown East headquarters, the North Star office building is in foreclosure. According to CBRE, the average metro vacancy rate dipped below the 10-year average of 16.8% to 16.3% in Q4 2017.

In the suburbs, tenants are running into rent fatigue with rents at the high end of the Class A market. Examples of this occurring are primarily in the West submarket along I-394. Combined with high operating expenses, the elevated gross rents are causing tenants to look for alternative options. The net rent spread in the West submarket for Class A and Class B space is about $5.00/SF and jumps to $8.00-$10.00/SF after including operating expenses.

This widening spread has some tenants looking at Class B options or different submarkets. With higher vacancy rates, the Southwest Class A office market rents are closer to West Class B office rents. As a result, brokers are seeing more success in leasing renovated Class B space.

The North Loop area remains a strong submarket with the expectation the area will see a few more value-add deals done in 2018.

Many tenants that renew space today are reducing their footprint while maintaining similar employee counts. The downsizing trend includes law firms, accounting firms, ad agencies, etc. This is creating pressure on parking ratios as office tenants are pushing for lower space per employee averages. Sometimes, the increased parking requirements are difficult to achieve.

At present time, there is little to no new speculative office development. The primary reason being rents are not sufficient to support new construction costs. Furthermore, shadow space is created as tenants continue to downsize and this keeps vacancy rates elevated.

Some of the historical co-working space providers such as Regus offer varying monthly lease rates for tenants depending on usage of on-site amenities such as secretarial services, food, etc. A few of the newer entrants to the market such as WeWork, Industrious, etc. are competing in the co-working space by offering smaller tenants an option to pay a fixed rental rate, but at a premium for the additional suite amenities.

The investment office sales market shows continued strong activity with about $750 million under contract and scheduled to close by end of February 2018. Cap rates for Class A, CBD buildings are sub 7.0%, smaller, above average buildings in the metro are in the range of 7.0% – 8.0% and about 8.0% -9.0% for older or fringe type locations.

Multifamily Market
Strong market fundamentals supported by job growth and lifestyle choices among baby boomers and millennials provide a continued sense of optimism in multifamily. While many would agree we are at a current high peak, 2018 will mostly likely be a higher peak because of the strong fundamentals.

One trend that has continued over the past 12 months is the appeal of value-add apartments. As new Class A building have been built with extensive amenities, a wide rent spread remains when comparing top Class A units to Class B/C units. This creates two multi-family markets, those who want and can afford Class A units and those who cannot afford or don’t want to pay the higher rents and settle for Class B and C units.

Another opportunity in Class B and C apartments is the implementation of RUBS, a utility billing method that allocates 100% of your property’s utility bill to the residents based on an occupant factor, square footage or a combination of both, less a predetermined percentage (determined by the owner) of a common area allowance. While historically offered in higher end apartments, owners have reported success with adding this option to lower quality properties.

To help combat the continued strong market activity of investors buying value-add properties with plans to renovate and increase rents, some non-profits have stepped in and bought apartments they view as naturally affordable. One example is when affordable housing owner and developer Aeon paid $36 million or $85,308 per unit in September 2017 for a 422-unit Richfield apartment complex it intends to preserve as workforce housing.

Construction costs are rising and finding construction labor is impacting projects, particularly delivery times. Payroll and maintenance expenses are higher with the current low unemployment. Some landlords are more challenged with finding adequate maintenance staff for mechanical repairs, etc. While dependent on the property size and number of units owned, one way to potentially offset this is centralizing repairs and maintenance staff across a portfolio instead of having maintenance staff at each individual property.

Real estate taxes are increasing with higher property values, but strong market sales data make it more difficult to argue for keeping taxes lower. As investors, particularly out-of-state buyers, it remains important to properly account for stabilized taxes in the pro-forma projections.

The value trend in 2017 was the same as previous years. Rent growth and low market vacancy led to strong value increases. The following market data compiled from REDI Comps shows value trends for 12-unit or larger apartment sales in Hennepin and Ramsey counties for 2016 and 2017.

Apartment Sale Trends

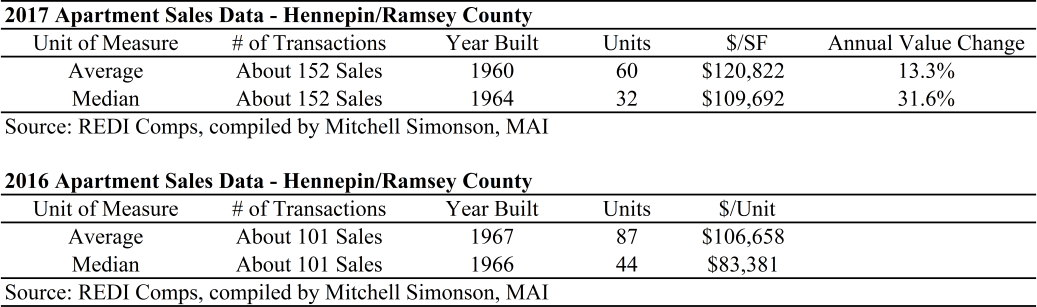
Based on the available data, 2017 had about 51 more transactions and the average sale price increased 13.3%. The median sale price showed an increase of 31.6%. One notable difference for 2017 compared to 2016 is there were several larger, newer Class A apartment sales. This factor, coupled with the strong market fundamentals significantly pushed up the average and median sale price for apartment properties in Hennepin and Ramsey County.

One recent market example that supports this significant value appreciation is the 500-unit Park Place Apartments in Plymouth, MN that last sold in September 2017. While important to note renovations were made between each sale date which upward influenced the sale prices, the following appreciation is revealed.

  • 9/2017 – $92.3 million – up 19.9% in 11 months
  • 10/2016 – $77 million – up 40.8% in about 5 years
  • $54.7 million – 2011 sale price

According to Colliers International Minneapolis/St. Paul Multi-Family Year-End 2017 report, “2015 set records with the highest total sales volume in Twin Cities history, hitting the $1 Billion mark which is almost double the historical average. In 2016, total sales volume surpassed $1.5 Billion and is currently on pace to exceed that figure and approach $2 Billion.”

Historically, annual sales volume of $500 to $750 million was the norm. This was largely driven by the fact the market was dominated by local investors who had long term buy and hold strategies. In recent years, the market has attracted national investors due to the desirable market fundamentals and strong, diversified economy. National investors tend to have shorter holding periods and focus on maximizing returns. As more national investors place the Minneapolis/St. Paul market on their radar and with shorter holding periods, higher sales volume seems probable.

While dependent on building quality, occupancy and location, cap rates for urban core Class A apartments have been in the approximate range of 4.5% to 5.0% and 5.0% to 5.5% for suburban Class A product. Recent treasury rate increases has tightened the spread on cap rates, but it’s expected longer term financing options will help keep cap rates at current levels. Cap rates for stabilized Class B properties range from about 5.5% to 6.25%. Finally, cap rates for Class C properties saw even more compression and are about 6.0% to 6.75%, with some dipping below 6%, depending on value-add opportunity.

My final thought – As I write this in January 2018, one consistent theme persists among the four property types in the Minneapolis/St. Paul – record highs. Strong rent growth and peak pricing for multi-family, record high office sale prices, record long positive absorption run for the industrial market, construction costs continue to rise and retail rents for select locations continue to escalate. On the stock market side, the Dow Jones Industrial Average, S&P 500 and Nasdaq Composite have risen to all-time record highs.

Most market participants express continued optimism as market fundamentals appear solid. If we look at history as any indication of future performance, one should at least be aware of the fact we are in a period of record highs. Assuming no particular shock hits the system in 2018, it seems most believe the record highs will continue. Nonetheless, it’s good to consider this when making investment decisions of any type.


Mitchell Simonson, MAI is an expert commercial real estate appraiser and investor. Since 2005, Mitchell has appraised hundreds of commercial real estate properties across many property types.

Real estate is a great vehicle to create long-term wealth! He speaks, consults and trains on Helping Lenders, Brokers and Investors Navigate the Appraisal Process and to ensure his clients are making wise commercial real estate investment and underwriting decisions to help them meet those goals.

To inquire about booking Mitchell for consulting or appear at your next conference or event, please email mitch@simonsonap.com or call at 612-618-3726.


Mid-Year 2017 Minneapolis/St. Paul CRE Trends

20170614_134241

Recent new development on West 7th Street in St. Paul, photo taken by Mitchell Simonson, MAI

Here are the best insights I gathered from the panel of speakers at the June 15, 2017 Commercial Real Estate Forecast Summit, put together by Jeff Johnson and the MN Real Estate Journal. They put together some excellent continuing education events. This half-day seminar focused on current real estate trends for retail, industrial, office and multi-family property types in the Minneapolis/St. Paul market.

Mid-Year 2017 Minneapolis/St. Paul Retail CRE Update

  • Online shopping continues to disrupt the retail market. Contrary to what the main stream media would lead you to believe (if you only read the headlines), this is not all bad. The entire retail panel expressed right now is an exciting time for retail and views the current environment as a time of opportunity. With changing consumer trends and demands, the disruption is forcing retailers to evolve and get better. This change is ultimately driven by higher consumer expectations seeking a more satisfying shopping experience.
  • Another common theme hammered by the main stream pundits is the retail market in the United States has too much retail space per capita. Someone provided a counter argument to this by citing a statistic that the top eight retail markets in the U.S. account for 33% of retail building square feet. Considering several states such as California and Texas have economies that exceed those of some European countries, the data suggests the high amount of retail is not always as bad as often stated.
  • One problem facing today’s retailers struggling to stay open. There are too many similar concepts, e.g. office supply stores or even some of the middle of the road clothing department stores. Stores such as Office Max, Staples, etc. are very similar, offer very little in terms of customer experience and ultimately begin to compete on price with online competition. Similarly, clothing stores that have not adapted to changing customer preferences and deliver exceptional service face a similar challenge.
  • Retailers and investors really need to be dialed into their store offerings.
  • The expansion of Hy-Vee grocery stores into the Twin Cities is giving Cub Foods a run for their money. Again, they are offering a superior customer experience and greater attention to detail to attract new business.
  • Mall properties, such as Southdale Mall in Edina, Minnesota closing the JC Penney and bringing in Lifetime Fitness is viewed as good move. It’s likely we’ll see more of this trend.
  • Fitness companies are a strong retail segment with many different smaller space options in the range of 2,500 to 4,500 square feet. They are offering specialty boutique fitness groups, such as cycling, yoga and feature a “community like” feel. It remains to be determined how many different concepts the market can handle.
  • Ecommerce in US is reportedly about 8-10% of sales. In Europe, online sales are about 16%. Thus, the growth of ecommerce is likely to continue.
  • Omnipresent distribution for retailers will be key.
  • Retail is flourishing in the 5 F categories right now, Food, Fitness, Fun, Furnishings, Family/Friends
  • A lot of stores closing now should have been closed years ago, such as Sears.
  • A lot of thriving stores are helping to create strong customer experiences.
  • More national buyers/investors looking at retail property in MN than historically.
  • Drugstore sale transaction volume is down in 2017.
  • The two largest proposed retail development opportunities in Minneapolis/St. Paul at present time include Orchard Place in Apple Valley and Avienda in Chanhassen. Both are proposed centers in the 400,000-square foot range.
  • Some infill retail will continue around new grocery store development
  • Retail will continue to see new growth in communities seeing residential growth. Retail follows rooftops.
  • Entertainment is becoming more important for driving retail. Additionally, people desire a sense of community and the experience for customers is key.
  • Some outstate MN markets have certain stores performing well.
  • Will likely see some grocery store fallout in Minneapolis/St. Paul in the next two to five years.
  • Restaurant and fast food sales have reportedly surpassed grocery store sales for first time.

Mid-Year 2017 Minneapolis/St. Paul Industrial CRE Update

  • The large space users needing 300,000+SF that were active in the market back in 2014/2015 have slowed. Part of this is caused by fewer users with that size requirement needing space and operating with a bit more caution.
  • A handful of tenants are looking for space in the 200,000-300,000-square foot range.
  • Many tenants looking for space in the 20,000-40,000-square foot range.
  • Costs for office buildouts are going up.
  • The math on some new, long-term industrial leases are able to pencil out with lower rents due to the tenant signing longer term leases and above average credit rating. An example of this cited was Room and Board, sub $4.00/SF rent with 500,000 S. The lower rate was partially tied to longer term lease and credit rating, etc.
  • Conversely, Opus recently signed a tenant for their new spec warehouse building in Plymouth. The building is an infill location with 90,000 SF, 24-foot warehouse clear height and 97% warehouse. The lease rate for this property was much higher.
  • In 2017, the Minneapolis/St. Paul industrial portfolio owned by Duke Realty is 99.5% leased. They are now working on a few proposed projects in Shakopee and 50 acres of land under contract in Maple Grove. The panel stated its hard finding good industrial sites at prices that pencil out.

Leasing Trends and Activity

  • Distribution users are really looking at cubic volume as a vital metric today – think higher warehouse clear height. Allows them to use less square feet.
  • Today, newer distribution centers operate more as fulfillment centers and require greater electrical power, more employee parking, larger land area for security, expansion, etc.
  • Finding locations with proximity to key employees and overall labor pool is important, especially with low unemployment rates. It’s requiring employers to be creative to attract employees.
  • Groups like Amazon are looking at robotics to help offset challenge of labor shortages. The Amazon Shakopee location is reportedly bussing employees from Minneapolis with wages of about $16-$18/hour.
  • At present time, it’s a very competitive investment market with low cap rates. Some seller groups, including a few national REITS have listed their industrial product for sale to see if buyers are willing to bite in the low cap rate environment.
  • The panel hasn’t seen a falloff yet with sales activity. Buyer groups range from local to national investors.
  • Rooftop solar is likely to increase in coming years as costs come down. It’s most likely attractive for 50,000-square foot buildings.

Mid-Year 2017 Minneapolis/St. Paul Office CRE Update

The first question posed to the panel is What is scaring your right now in the Minneapolis/St. Paul office market? Here is some of the feedback.

  • A lot of space coming back on the market, especially with several recent new build-to-suit office buildings for corporate users. The challenge is how will that space be repurposed?
  • There is heavy demand on institutional investors to place capital. That is increasing valuations and thus real estate taxes.
  • Some brokers are seeing more uncertainty among investors. One factor is the potential for changes in 1031 exchanges. Investors like certainty and when there are unknowns not yet worked out, it creates uncertainty.
  • Finding good, skilled workers is a challenge to help spur continued job growth. Landlords need job growth to fill vacancy rates.
  • The ability to offer in-building amenities are vital for office space in the current market. Tenants are demanding training centers, fitness centers, in-building collaboration areas and even outdoor amenity areas.
  • A recent example of a property owner taking action to backfill vacated space is the Baker Center office building in downtown Minneapolis. Wells Fargo vacated and the owner spent millions to renovate and add several amenities. The space is now reportedly generating a lot of activity.
  • Landlords and new buyers are coming in and renovating with amenities. One benefit that is different from past cycles is buyers are not as highly leveraged with debt.
  • In addition to amenities, tenants are looking for quality landlords. The experience of the building and being able to tell a story to the market is helpful to attract new tenants.
  • The Colonnade Class A office building in Golden Valley is on the I-394 corridor and listed for sale with office rents at $23-$24/SF, net. Stabilized operating expenses are forecasted at about $18.00/SF, resulting in gross rents approaching the low to mid $40’s.
  • Tenants are looking at ways to attract and retain employees and looking more closely at price per employee versus purely Rent/SF. The thought here is if a company can keep employees by being able to offer the best amenities, they sometimes are willing to pay a bit more. The higher cost to replace employees can quickly offset rent savings caused by being in an inferior location or building with limited offerings.
  • Large buildings with large vacancies, particularly in suburbs are tougher to fill.

Where are we at in the current office market cycle?

  • Using a baseball analogy, the office panel generally agreed we’re in the 5th or 6th The capital markets which generally help support the office market are still strong.
  • A lot of professionalism coming to office real estate. Buyers are well leveraged.
  • Where will new office tenant demand come from is a question in the market.
  • Why no new office spec on I-394? Hot spots tenants want to be at right now include the intersection of I-394/State Highway 100, the North Loop, or downtown Minneapolis
  • The two most recent speculative office buildings built in the Twin Cities are the T3 timber frame office building developed by Hines in the North Loop neighborhood and Offices at MOA, a 10-story office buildingat the Mall of America. It was reported both buildings took longer than expected to lease up and likely didn’t achieve pro-forma rents. These recent developments were identified as reasons why people remain skittish to go spec. Furthermore, it’s tough to get enough high enough rents to justify the new construction.
  • Building amenities will continue to be a driver.
  • Record setting trend of office sales will continue in 2017.
  • Suburban office buildings will likely begin to add amenities and promote free parking to try attracting tenants from downtown Minneapolis.
  • The St. Paul office market is pretty quiet with several dated buildings.

Mid-Year 2017 Minneapolis/St. Paul Multi-Family CRE Update

  • Expected new delivery of 5,700 apartment units in 2017 across the Twin Cities market, equates to about 1.7% of total existing stock. While above average when compared historically, the opinion is market is still working to offset limited new construction over many years.
  • Minneapolis is viewed quite favorably by investors.
  • New Construction supply concern is greater in other markets across the U.S.
  • Some cities in the Midwest such as Des Moines, Iowa are bringing in grants, TIF, etc. to support new development and higher end product due to lower market rent expectations.
  • IRET Properties recently purchased Oxbo Apartments in St. Paul, MN, a mixed-use project. The property sold at 42% occupancy and the buyer felt the got a slight discount due to below market occupancy. Average rent for occupied units was reported at $1,800. Applying a 8% cap rate to retail space, the $61.5million sale price equates to $301,000/unit.
  • Targeted returns on both cap rates and IRR.
  • Still seeing cap rates around 4.5% for new urban apartments and 5.25% to 5.5% for new institutional grade suburban apartments across the metro.
  • There’s been a slight shift in demand for pre-stabilized assets over past few years. Not quite as strong as a few years ago. Pricing is a bit more of a concern at present time.
  • With strong market appetite in recent years, sales volume has been strong. One developer, Sherman Associates anticipates holding more properties over the next 24 months. They reported construction apartment financing has pulled back a bit in some markets in different states.
  • IRET Properties will continue to hold existing properties in smaller markets, but is looking to deploy new capital in larger markets such as the Twin Cities.
  • With 39,000 new jobs added in last year, and about 9,000 new multifamily units over two years, equals about 4.5 new jobs/unit
  • More talk and development of micro units. Units called Junior 1, with partial bedroom wall and units in the 440 to 500-square foot size range have been also built,
  • New amenities in multi-family – developers are trying to look at technology, e.g. could tenants just leave their unit with only their phone.
  • Working to improving concierge services.
  • Larger storage spaces are being added in the units, this is especially important for people such as baby boomers who are downsizing, but moving with more items.
  • Trends from Class A amenities will continue to move into Class B projects.
  • An amenities arms race is occurring.
  • Potential headwinds included rising construction costs and property taxes. Construction costs continue to go up. For now, increasing market rents have helped offset the higher costs.
  • Property taxes are a challenge.
  • Interest only money availability has helped new construction. If this trend begins to shift, that could impact new construction.
  • Tenants are demanding more today. This results in higher human resource costs such as needing to hire better property management and concierge services. With the construction market so strong, repair and maintenance payroll costs are climbing.

Mitchell Simonson, MAI is an expert commercial real estate appraiser and investor. If you have a market related question, please feel free to call at 612-618-3726 or email mitch@simonsonap.com.

2017 Outstate MN Apartment Trends

dscn6529

Over the past 12 months, I have appraised numerous outstate Minnesota apartments ranging in size from about 20 to 150 units. The geographic region has spanned the “banana belt” surrounding the Minneapolis/St. Paul metropolitan area. The primary cities forming the “banana belt” include Rochester, Mankato, St. Cloud and Duluth. This allows us to complete in-depth analysis of historical income and expense statements on assignments completed throughout the year. Additionally, our firm supplements the internal observations and data by constantly interviewing apartment owners, brokers, property managers and lenders.

This article discusses general rent, vacancy, operating expense, and capitalization rate trends in outstate Minnesota. A quick overview of each is summarized below, followed by more details.

Rents – Generally speaking, rents remained strong in 2016 with most communities able to increase rents. The exception is Fargo/Moorhead where rents are flat as supply exceeds current demand.

Vacancy Trends – Vacancy rates in communities such as St. Cloud, Mankato, Rochester, county seats and smaller communities remained quite low. Fargo/Moorhead is experiencing significant over supply and vacancies have climbed to 9.2%.

Operating Expenses – Operating expenses in outstate Minnesota have held pretty stable. With rising sale prices, real estate taxes continue to be a concern for property owners.

Cap Rates – Cap rate compression was prevalent in 2016 and more noticeable in the larger metro areas such as St. Cloud, Rochester, and Mankato. More buyers extended out from the Minneapolis/St. Paul metropolitan in search of investment opportunities with higher yields.

Rent Trends – The quick story here is rents continued their upward ascent that has now been in place for several years in the outstate MN apartment market. Overall, low vacancies and steady renter demand allowed owners and managers to implement one or more rent increases. A few participants reported rent growth of 5% to 8%. However, not all properties are operated and managed the same and some owners tend to be more conservative with regard to rent growth.

It seems the one notable exception is the Fargo/Moorhead metropolitan area. As the physical vacancy rate approaches 10%, rents have held flat for the last 18 months and new apartments coming online are offering rent concessions to lease-up (Appraisal Services, Inc.). Another market to keep an eye on over the next 12 to 18 months is the St. Cloud metropolitan area as multiple projects are under construction. At present, the St. Cloud market remains healthy with rent growth reported across all apartment classes.

By and large, rent increases occurred in 2016 across smaller communities such as county seats. This is attributable to fewer new units being added in these areas as rents are lower and make it more difficult to justify new construction. Some participants opined rent increases may slow some in 2017.

Vacancy Trends – In 2016, it seemed every outstate community surveyed with the exception of Fargo/Moorhead had stabilized vacancy rates (less than 5%). There was some thought one year ago that vacancies may rise slightly in 2016. However, based on the data, this did not appear to be the case.

According to data compiled by Fargo appraisal firm Appraisal Services Inc., the current vacancy rate in Fargo-Moorhead metropolitan area is 9.21%. This represents a substantial increase from 6.4% one year ago. The following table shows the quarterly vacancy rate and number of units under construction in the Fargo-Moorhead metropolitan area over the past five years.

fma-vacancy-and-construction

Source: Appraisal Services Inc

Over 6,000 units have been added to the Fargo market area since 2012 when vacancy rates were at the floor of 2.5% metro wide. Across Minnesota, a healthy economy, steady tenant demand and reasonable pace of construction have resulted in minimal vacancy risk. Most participants do not anticipate significant changes in vacancy in 2017.

Operating Expenses – Real estate taxes are generally cited as the one major area of concern. As values have increased over the past few years and sales become available, this tends to be the one consistent expense line item that is of concern to investors. Utility expenses tend to increase annually. A review of historical operating expenses for most properties suggests relatively stable expenses for other line items. With low vacancies in most markets and steady rent increases, operating expense ratios have stayed flat or decreased. Rising labor and maintenance costs have reportedly been a concern in Minneapolis/St. Paul metro area properties, but not so much in outstate areas.

Capitalization Rates

Capitalization rates continued to compress across outstate Minnesota in 2016. It was evident more buyers were searching for investment opportunities beyond the Minneapolis/St. Paul metro area. Based on actual data points and multiple conversations with owners and brokers, cap rates compressed approximately 20 to 50 basis points. One good example is the St. Cloud metropolitan area. For many years, buildings with 12 to less than 50 units and constructed in the 1970s and 1980s seemed to sell for about $45,000 per unit and traded with cap rates in the 7.75% to 8.25% range. Last year, the compression resulted in cap rates closer to 7.5% and higher per unit sale prices.

Higher quality apartments in the larger communities (such as Fargo, Mankato, St. Cloud, etc.) are in the approximate range of 6.25% to 7.00%. Rochester and St. Cloud saw a few larger, newer properties trade with cap rates below 6.0%. Cap rates for average-to-good quality properties in smaller communities trended lower, and generally range from about 6.75% to 7.75%. Properties with some level of deferred maintenance and/or older properties tend to sell at cap rates of 8.00% and above. Of course, each property is unique and must be analyzed independent of the general market parameters.

Most market participants report general optimism for continued strength in the outstate apartment market, particularly with a stable tenant base.

What are your expectations for outstate MN apartment activity in 2017?

Are you looking for information on valuation trends in Minneapolis/St. Paul metro area? This link can help you: Minneapolis/St. Paul – 2017 Commercial Real Estate Trends and Expectations

Mitchell Simonson, MAI is an expert commercial real estate appraiser and investor. If you have a market related question, please feel free to call at 612-618-3726 or email mitch@simonsonap.com.

Minneapolis/St. Paul – 2017 Commercial Real Estate Trends and Expectations

downtown-mpls-photo

I attended the 2017 Minneapolis/St. Paul Commercial Real Estate Valuation and Appraisal Forecast Summit held at the Golden Valley Country Club on Friday, January 20, 2017. Topics centered on valuation trends for the retail, industrial, office and multi-family property sectors. This article looks back on some key highlights from 2016 and expectations in 2017.

My Top Takeaways for the Four Property Types

Retail – Cap rates initially compressed in early 2016 then stabilized and have ticked up slightly in the past 30 to 90 days.

Industrial – Continued growth of ecommerce is helping fuel industrial development and change space need requirements. Limited supply exists for owner user buildings less than 25,000 square feet.

Office – Bifurcated submarkets continue to exist in the Twin Cities. Some very strong submarkets and buildings with good rent growth and other markets or buildings remain challenged.

Multi-Family – About a $1,000 rent spread exists in some submarkets for high-end Class A properties compared to Class B/C assets. Cap rates for Class A properties were pretty flat in 2016. Cap rate compression continued for Class B and C properties, particularly with the wider rent spread.

Retail Market

Rental rates for existing retail properties Minneapolis/St. Paul metropolitan area saw minimal growth over the past 12 months. New construction costs are higher, causing rental rates to increase for new developments. It’s common for rental rates for new construction, single tenant retail buildings to be in the $40 to $65 per square foot, net range. Overall occupancy costs will continue to rise as CAM and taxes increase.

Health ratios or total cost of occupancy/gross sales can vary among retail tenants from 5%-20%. This is a vital metric in determining the long-term viability of tenants and important for investors to try obtain in-store sales. However, sales data is not always readily available.  Restaurants want lower ratios near 8%, whereas quick lube facilities net rents are often 12% to 16% of gross sales.

Cap rates trends were mixed over the past year as they initially compressed in early 2016, then stabilized and have ticked up slightly in the past 30 to 90 days. The main factor contributing to the increase in cap rates for retail properties is the rise of treasury rates. During 4th Quarter 2016, the 10-year Treasury Yield increased 82 basis points to 2.45, up from 1.62 at the start of the quarter. Spreads for interest rates are currently about 160 to 210 basis points above 10- year treasury.

The cap rate range for retail properties in the Twin Cities is generally 4% to 8%. The low end of the range reflects ground leases with tenants such as McDonalds. Often times, they will lease the land and construct their own building. This has a lower level of risk to the owner of the real estate because they receive a steady income stream from a strong credit company, and at the end of the lease term, would retain the building if the tenant vacates.

For strong credit, triple net tenants, cap rates are about 5.0% to 6.0% and about 6.0% to 7.0% for moderate credit tenants. The Walgreens merger with Rite Aid has slowed transaction volume in the drug store sector due to uncertainty among investors about future store closures, etc. CVS stores are now trading at a slight premium over Walgreens due to added Walgreens/Rite Aid supply to the market and changing lease terms.

Multi-tenant retail centers cap rates tend to be slightly higher in the range of about 7.0% to 8.5%. Class C properties, particularly in outstate MN exhibit a wide cap rate range and can approach 10% or higher, depending on the tenant mix, location, etc.

According to the Net Lease Market Report, 4th Quarter 2016, the expectation is there will likely be upward movement in cap rates moving forward. As part of the Net Lease Report, The Boulder Group conducted a national survey and the vast majority of active net lease participants expect cap rates to rise in 2017. The largest segment of net lease participants expect cap rates to increase between 25 and 49 basis points by the end of 2017.

Industrial Market

From manufacturing to service industries, e-commerce continues to change industrial trends with delivery times an important factor. This continues to drive demand for distribution centers, with cubic volume a major consideration as buildings with 32 to 36 foot clear heights are being built. It’s interesting how building and design trends change over time. In the not too distance past, high ceiling heights often resulted in some degree of functional obsolescence as they tended to be designed for special purpose uses.

One panel member cited an interesting statistic tied to the changing industrial demand needs for retailers. Reportedly, a traditional brick and mortar retail company with $1 billion in sales needs about 300,000 square feet of warehouse space as they also use their stores for storage. This compares to 1.2 million square feet of industrial space needed for an online retailer doing $1 billion in sales.

The story in 2016 was positive absorption, particularly the speculative industrial development that was delivered in 2015. About 2.6 million square feet of speculative industrial development was delivered in 2015, of which about 80% was located in the Northwest and Southwest submarkets. About 1.9 million square feet of this speculative space was reportedly vacant 12 months ago. Brokers indicated approximately 60% to 65% of the spec space was absorbed in 2016 and about 1.5 million square feet of build-to-suit space was absorbed. According to Colliers International, about 2.63 million square feet was absorbed in 2016. This is lower than the 2015 peak of 2.96 million square feet, but still well above the 10-year average. The panel indicated a lot of organic absorption occurred with tenants upgrading to newer, more efficient space.

Much of the new construction added in prior years was in outer ring suburbs such as Rogers, Dayton, and Shakopee. As of 4Q2016, Colliers International Industrial Report stated 32% of the vacancy in the entire bulk warehouse market was located in Rogers and Dayton, which comprise just 5.3% of the bulk warehouse inventory. Developers are looking for infill sites as companies seek amenities to accommodate employees. With some new product still vacant, developers are cautiously optimistic heading into 2017 and a little less bullish. Overall, the industrial panel members held a mostly optimistic view for the industrial market.

Owner user buildings in the 10,000 to 20,000 square foot range are in limited supply. Most buildings receive multiple offers when listed for sale.

Office Market

The panelists expressed optimism the capital markets will remain strong in 2017 and into 2018. Buyers are looking for Class A office buildings and even B and C buildings as several Class A buildings have traded in recent years. Cap rates for Class A office are in the approximate range of 6.0% to 8.0%, Class B at 7.0% to 8.5% and suburban Class C cap rates are about 8.0% to 10.0%.

One panel member discussed how historically, rents at the high end of the market topped out around $35.00/SF, gross. This has changed more recently as some upper floor lease rates in buildings such as the IDS Center have seen deals near $40/SF, gross. As some longer term office owners have sold and moved out of the market, newer institutional owners haven’t been afraid to push rates. Of course, the strength of the local economy is a contributing factor as well.

The trend of smaller, specific submarkets outperforming the broader office market has continued. Submarkets and buildings that are able to create unique opportunities include areas such as the North Loop, I-394 Corridor in the West Submarket, France Avenue in Edina and Class A buildings in downtown Minneapolis. These markets have been able to push rental rates higher and vacancy rates are lower. The cost of and availability of parking in the North Loop neighborhood is a concern. Recent proposed office developments in the North Loop area incorporate needed parking spaces.

It was reported much of the sublease space available on the market from about 2012 to 2015 has been backfilled. Absorption was down in 2016, compared to the past few years. This is partly attributable to Wells Fargo vacating out of a few buildings and moving to their new headquarters in Downtown East totaling 1.1 million square feet. Absorption is also affected by other build-to-suit owner user completions. Long-term, the commitment by larger corporations based in the Twin Cities to invest in new space is beneficial as it helps maintain and create jobs and business opportunities.

Multi Family Market

About $1.5 billion in total sales volume was reported for 2016 which is another record year for the Minneapolis/St. Paul metropolitan area. This increased sales activity has led to more competition from more parties, including national investors and is more difficult for some buyers to pencil out the deals. Given the extended strength of the market in terms of rent growth for several years, this has pushed up values and led more buyers to pursue tertiary markets and lower quality units.

Value-add opportunities continue to exist. One panel member discussed how the rent spread between Class A to B properties historically was closer to $150 to $200 per unit, per month in the Twin Cities. As new Class A building have been built with extensive amenities, about a $1,000 per month rent spread is present when comparing top Class A units to Class B/C units. This creates two multi-family markets, those who want and can afford Class A units and those who cannot afford or don’t to pay the higher rents settle for Class B and C units.

The multifamily panel agreed that it is difficult in the current market to forecast stabilized real estate taxes. This is a concern for investors and lenders. Some buyers are 1031 buyers or buying for tax shelter purposes which creates different motivations and can result in higher sale prices. With the continued trend of higher sale prices, assessed values and real estate taxes continue to escalate.

There was discussion among the panel about pressure or challenges for landlords to find adequate maintenance staff for mechanical repairs, etc. with the current tight labor market. In some instances, this has impacted maintenance/payroll expenses. On the flip side, more tenants are starting to be charged back for utilities in Class B/C apartment units which help lower operating expenses and increases NOI.

With challenges in terms of new rent growth, higher vacancy and some concessions, capitalization rates for newer, Class A multi-family product held relatively flat in 2016.  Additionally, lenders are scrutinizing new construction projects more closely and investors are selective with location, size and completion timelines. While dependent on building quality, occupancy and location, cap rates for urban core Class A apartments have been in the approximate range of 4.5% to 5.0% and 5.0% to 5.5% for suburban Class A product.

Cap rate compression continued in 2016 for Class B and C product with the value-add opportunities and ability to raise rents. Cap rates for stabilized Class B range from about 5.5% to 6.25%. Finally, cap rates for Class C properties saw even more compression and are about 6.0% to 6.75%, with some dipping below 6%. Cap rates are down about 50 to 75 basis points from 2014/2015.

What challenges or growth opportunities do you see for 2017?

Mitchell Simonson, MAI is an expert commercial real estate appraiser and investor. If you have a market related question, please feel free to call at 612-618-3726 or email mitch@simonsonap.com.


SBA Lending and Appraisal Insights

20161020_160348I recently taught a workshop titled Navigating the Appraisal Process at the 4th Annual SBA Lender Conference in Minnesota. Continuing the theme from last month, this article highlights some key terms and thoughts about going concern value and specific U.S. Small Business Administration business and real estate appraisal requirements. I presented some ideas to help lenders, banks reviewers and appraisers.

Going Concern Value – The market value of all the tangible and intangible assets of an established and operating business with an indefinite life, as if sold in aggregate; more accurately termed the market value of the going concern.

  • The value of an operating business enterprise. Goodwill may be separately measured but is an integral component of going-concern value when it exists and is recognizable.
  • The going concern valuation includes certain assets of the business enterprise including real property, FF&E, and business value.
  • Examples include gas stations, assisted living, restaurants, hotels, etc.

SBA – Real Estate Appraisal Requirements

Commercial Real Estate

SBA requires a real estate appraisal if the SBA-guaranteed loan is greater than $250,000 AND is collateralized by commercial real property.

  • For all loans greater than $250,000, secured by commercial real property, federally regulated lenders must obtain an appraisal by a state licensed or certified appraiser and otherwise follow their primary regulator’s FIRREA requirements for real estate appraisals. Appraisals must be in compliance with the Uniform Standards of Professional Appraisal Practice (USPAP). The SBA or the lender may require an appraisal of real property by a State licensed or certified appraiser in connection with a loan for $250,000 or less, if such appraisal is necessary for appropriate evaluation of creditworthiness.

The appraiser must be:

  1. independent and have no appearance of a conflict of interest (such as a direct or indirect financial or other interest in the property or transaction); and
  2. either State-licensed or State-certified with the following exception: when the commercial property’s estimated value is over $1,000,000, the appraiser must be State-certified.

Real Estate Eligible for SBA Loans

  • Businesses such as barber shops, hair salons, nail salons, and similar types of businesses are eligible, regardless of whether they have employees or contract with individuals to provide the services.
  • Hotels, motels, recreational vehicle parks, marinas, campgrounds, or similar types of businesses are eligible if more than 50% of the business’s revenue for the prior year is derived from transients who stay for 30 days or less at a time.

Real Estate Eligible Uses of Loan Proceeds

SBA Guaranteed Loan Proceeds May Be Used To:

  1. Acquire Land and/or purchase, construct or renovate buildings;
  2. Improve a site (e.g. Grading, streets, parking lots, landscaping), including up to 5 percent of the loan amount for community improvements such as curbs and sidewalks;
  3. Energy Conservation loans; or
  4. Refinancing

Requirements When Leasing Part of a Building Acquired with SBA Loan Proceeds

  1. Amount of rentable property that can be leased:
  2. a) For an existing building, a small business must occupy 51% of the rentable property and may lease up to 49%; and
  3. b) For new construction, a small business must occupy 60% of the rentable property, may permanently lease up to 20% and temporarily lease an additional 20% with the intention of using some of the additional 20% within three years and all of it within 10 years.
  4. c) An Eligible Passive Company (EPC) must lease 100% of the rentable property to an OC. The OC must follow items a) and b) above.
  5. d) Circumstances may justify allowing the SBC a period of time after closing of the SBA loan to comply with the above occupancy requirements. For example, a pre-existing lease may have a few more months to run. In no case may the small business have more than one year to meet occupancy requirements.
  6. e) The restrictions in a) and b) above apply regardless of whether the rentable property is leased to a commercial or residential tenant.
  7. f) The applicant may not use loan proceeds to improve or renovate any of the Rentable Property that is leased to a third party

Real Estate Not Eligible for SBA Loans

  • Passive businesses owned by developers and landlords that do not actively use or occupy the assets acquired or improved with the loan proceeds (except Eligible Passive Companies) are not eligible.
  • Land Subdivisions
  • Businesses that are primarily engaged in owning or purchasing real estate and leasing it for any purpose are not eligible, e.g. shopping centers.
  • Apartment buildings and mobile home parks are not eligible.

Next are a few triggers that require a business appraisal. Thanks to Brandon Hall, Owner of BGH Valuation, http://www.bgh-valuation.com/  for his help in this piece.

Business Appraisal Requirements

Non-Special Purpose Properties

  1. If the amount being financed (including any 7(a), 504, seller, or other financing) minus the appraised value of real estate and/or equipment being financed is $250,000 or less, the lender may perform its own valuation of the business being sold, unless the lender’s internal policies and procedures require an independent business appraisal from a qualified source.
  2. If the amount being financed (including any 7(a), 504, seller, or other financing) minus the appraised value of real estate and/or equipment is greater than $250,000 or if there is a close relationship between the buyer and seller (for example, transactions between family members or business partners), the lender must obtain an independent business appraisal from a qualified source.

A “qualified source” is an individual who regularly receives compensation for business valuations and is accredited by one of the following recognized organizations:

  • Accredited Senior Appraiser (ASA) accredited through the American Society of Appraisers;
  • Certified Business Appraiser (CBA) accredited through the Institute of Business Appraisers;
  • Accredited in Business Valuation (ABV) accredited through the American Institute of Certified Public Accountants; and
  • Certified Valuation Analyst (CVA) or Accredited Valuation Analyst (AVA) accredited through the National Association of Certified Valuation Analysts.

A “Special Purpose Property” is a limited market property with a unique physical design, special construction materials, or a layout that restricts its utility to the specific use for which it was built.

  • When the loan financing any portion of the acquisition of a business is over $250,000 or if there is a close relationship between the buyer and seller (for example, transactions between family members or business partners) and the business operates from a Special Purpose Property, the lender must obtain an independent appraisal performed by a Certified General Real Property Appraiser.
  • The appraisal must allocate separate values to the individual components of the transaction including land, building, equipment and intangible assets.
  • The Certified General Real Property Appraiser must have completed no less than four going concern appraisals of equivalent special use property as the property being appraised, within the last 36 months, as identified in the qualifications portion of the Appraisal Report. Generally speaking, the particular area of expertise for the Certified General Appraiser is the real estate component.

Mitchell Simonson, MAI is an expert commercial real estate appraiser and investor. For more specific questions or clarifications, please contact Mitchell Simonson, MAI at mitch@simonsonap.com or 612-618-3726.

Helping Lenders Navigate the Commercial Real Estate Appraisal Process

In September 2016, I participated in the 4th Annual SBA Lenders Conference at Marriott Minneapolis Northwest, Brooklyn Park, Minnesota. I was a speaker at the SBA Lenders Conference and my presentation was titled “Navigating the Appraisal Process” on September 8, 2016. Having worked with several different lending institutions completing appraisals for SBA financing, I presented some ideas to help lenders, banks reviewers and appraisers.

Lenders, what’s in it for you?

photo

I believe it’s important for appraisers to communicate with their clients to avoid surprises and ensure the appraisal process is as smooth as possible. My core passion is transparency and helping our clients make sound investment decisions and solve real estate problems to achieve their financial and business goals.

Understanding the perspectives of the appraiser and bank appraisal reviewers/credit analysts’ help lenders communicate with the borrower at the onset of the real estate financing process.

Lenders work with real estate investors and owners of small, medium and large businesses (borrowers) to help them secure financing to purchase and refinance real estate that fit their investment criteria and fulfill their business needs. As investors and owners of businesses, these individuals carry many responsibilities, of which financing real estate is one component. The lender can help the borrower ease this process in several ways.

Lenders have a desire to get the appraisal completed in a timely manner to assist the borrower in focusing on their business or other investment needs. Lenders are in communication with the bank reviewer/credit analyst from the onset and want to ensure the appraisal is proceeding without any major setbacks. If something comes up that may impact delivery or information is missing, it is important for the lender and appraiser to inform the bank reviewer/credit analyst.

What is an appraisal?

An appraisal is an objective, impartial, and unbiased opinion about the value of real property prepared by a State Licensed or Certified professional appraiser.

The role of the appraiser is to provide arm’s length, third party, neutral, and unprejudiced opinions about the value of real property and provide assistance to those who own, manage, sell, invest in, or lend money on real estate. Appraisers assemble a series of facts, statistics, and other information regarding specific properties, analyze this data, and develop opinions of value. Some of the standards appraisers are required to comply with include:

  • Uniform Standards of Professional Appraisal Practice (USPAP) – are considered the quality control standards applicable for real property.
  • FIRREA and Bank Guidelines
  • Interagency and Evaluation Guidelines
  • SBA Appraisal Requirements

Defining the Appraisal Scope of Work

This is a decision where the lender can help the bank appraisal reviewer/analyst.   In solving any problem including an appraisal problem, there are three basic steps to the process:

  • Identify the problem,
  • Determine the solution (or scope of work), and
  • Apply the solution.

What property should be appraised?

Does the collateral match what’s included in the appraisal? The borrower may own multiple properties, sometimes in close proximity to one another. It is very helpful and can save time and avoid later questions and scope of work revisions to identify the actual property to be appraised. It is important to clarify if adjacent parcels are owned by the borrower and if they are to be included in the appraisal. Helpful information includes tax parcel numbers, legal descriptions, number of buildings, building size, etc.

Key Appraisal Items to Communicate

Fee Simple Interest – The fee simple interest is the most complete form of property ownership. Fee simple interest is defined as absolute ownership unencumbered by any other interest or estate, subject only to the limitations imposed by the governmental powers of taxation, eminent domain, police power, and escheat. Under fee simple ownership, a property owner may occupy the property and also has the right to sell, lease, mortgage or give an interest away.

Examples: Owner occupied properties don’t have a lease in place and so the property is appraised based on market rents. Some building owners may structure a lease with a separate related entity that operates the business. Note that U.S. Small Business Administration (SBA) loans require a separate entity for the Eligible Passive Company (think real estate) and Operating Company (think business). However, these leases are not considered arm’s length because they are between related parties, can be cancelled or revised at any time, and generally not relied upon.

Sometimes, a building will have all short-term (less than 12 month) leases. Most lenders will request the fee simple interest be appraised. The understanding here is the tenants could vacate and a more reliable value is provided by the fee simple analysis based on market rents.

Leased Fee Interest – Defined as the ownership interest held by the landlord, which includes the right to receive the contract rent specified in the lease plus the reversionary right when the lease expires.

Examples: A building owner has a single lease or multiple leases with tenants. When a property has longer term leases in place, even at market rates and terms, the interest appraised is typically leased fee. The value may be the same as fee simple, but the interest is identified as a leased fee. Common scenarios include single tenant buildings with leases exceeding 12 months and multi-tenant commercial buildings with lease that have varying lease expirations.

Helpful Items to Provide for the Appraisal

  • Site and Building Details
  • Title work
  • Environmental Information
  • Purchase Agreement
  • Income Information
  • Arm’s length vs. related party leases
  • Historical Income & Expense Statements – Verify the owner’s consolidated statements match up with tax returns
  • Signed lease documents, detailed rent roll, etc.
  • New construction or planned renovations – Actual construction cost statements, plans, material specifications, etc.

Value Scenarios

What is Market Value As Is and When is it Used?

Market Value As Is – The estimate of the market value of real property in its current physical condition, use, and zoning as of the appraisal date. (Interagency Appraisal and Evaluation Guidelines) Note that the use of the “as is” phrase is specific to appraisal regulations pursuant to FIRREA applying to appraisals prepared for regulated lenders in the United States. The concept of an “as is” value is not included in the Standards of Valuation Practice of the Appraisal Institute, Uniform Standards of Professional Appraisal Practice, or International Valuation Standards.

(Source: The Dictionary of Real Estate Appraisal, Sixth Edition, Appraisal Institute, Chicago, Illinois, 2015)

SBA Appraisal Requirement – If the loan will be used to acquire an existing building that does not require construction, the appraiser should estimate market value on an as-is basis. If the appraiser estimates the value other than on an as-is basis, the narrative must include an explanation of why the as-is basis was not used.

Prospective Values

What is the actual occupancy of the property? Lenders, prior to sending the loan request to the review appraiser, find out what the building occupancy is. If a building has significant vacancy (above market), more than one value is generally required. This simple step ensures the proper bid request is made.

Prospective Market Value As Completed and As Stabilized

A prospective market value may be appropriate for the valuation of a property interest related to a credit decision for a proposed development or renovation project. According to USPAP, an appraisal with a prospective market value reflects an effective date that is subsequent to the date of the appraisal report. Prospective value opinions are intended to reflect the current expectations and perceptions of market participants, based on available data. Two prospective value opinions may be required to reflect the time frame during which development, construction, and occupancy will occur.

The prospective market value—as completed—reflects the property’s market value as of the time that development is expected to be completed. The prospective market value—as stabilized— reflects the property’s market value as of the time the property is projected to achieve stabilized occupancy. For an income-producing property, stabilized occupancy is the occupancy level that a property is expected to achieve after the property is exposed to the market for lease over a reasonable period of time and at comparable terms and conditions to other similar properties

SBA requirements for prospective values – If the loan will be used to finance new construction or the substantial renovation of an existing building, the appraisal must estimate what the market value will be at completion of construction. (“Substantial” means rehabilitation expenses of more than one-third of the purchase price or fair market value at the time of the application.) After construction is completed, lender must obtain a statement from the appraiser, general contractor, project architect, or construction management firm that the building was built with only minor deviations (if any) from the plans and specifications upon which the original estimate of value was based. If the lender cannot obtain such a statement, then the lender may not close the loan without SBA’s prior written permission.

My goal is sharing these ideas will help lenders, bank reviewers, and appraisers ensure a smooth appraisal process to help projects get completed in a timely and efficient manner! What has your experience been navigating the appraisal process?

Mitchell Simonson, MAI is an expert commercial real estate appraiser and investor. For more specific questions or clarifications, please contact Mitchell Simonson, MAI at mitch@simonsonap.com or 612-618-3726.